Peak+ Data Center Site Performance
Summary for the Period July 1 - July 31, 2025
Peak+ deploys sensors to measure site performance as part of its core product package. Those sensors collect data on weather, temperature, unit status, and Peak+ performance at a unit level on every site. This data is available to all customers via our real-time dashboard and can also be integrated into customer BMS Systems.
We have over 100 sites currently operating in the United States and have significant real time data on all the sites where we operate. The purpose of this study is to provide a snapshot of performance across all key geographies for the period July 2025. Below, we will show the temperature drop for the condenser section of the HVAC unit in each of the following key geographies for the examination period:
Phoenix, AZ
Denver, CO
Bend, OR
Los Angeles, CA
Secaucus, NJ
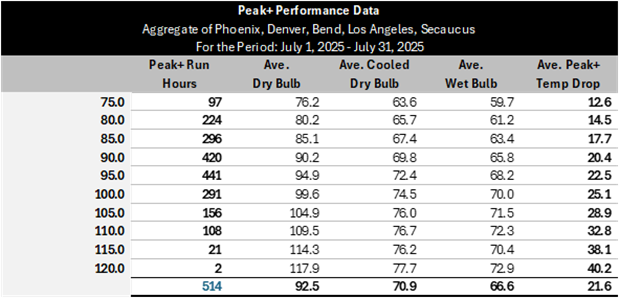
The table below shows summary temperature data for July 2025 aggregated across all the sites included in this analysis as well as average Dry Bulb & Wet bulb temps at those bins. The “Ave. Dry Bulb” is the ambient air temperature around the unit, and the “Ave. Cooled Dry Bulb” is the air temperature after being cooled by the Peak+ System (the temperature of the air entering the HVAC coils). The “Ave. Peak+ Temp Drop” shows the cooling effect of Peak+.
This data is measured, on-site data collected primarily from datacenter customers over the course of July 2025. A few things to note before we dive in:
We have sensors on the compressor(s) for each unit we are on, our system only activates if the circuit where our system is deployed is active. Many datacenters cycle through their units as part of standard operating procedure, so we are only showing temperature drop data below when the units were in operation.
Key Data Points included as inputs into in this analysis are as follows:
Dry Bulb temperature (Source: Weather Station): Each unit has its own weather station. The Dry bulb temperature is collected and logged at the unit level.
Wet Bulb Temp (Source: Weather Station): Each unit has its own weather station. The wet bulb temperature is collected and logged at the unit level.
Peak+ Cooled Dry Bulb (Source: Temp Sensor): We deploy a dry bulb temperature sensor behind the Peak+ frames on each circuit (Typically 2 per chiller unit).
Chiller Compressor Power (Source: Power Sensor): we deploy a power sensor on each circuit of the unit. The Peak+ system only activities if the circuit of the HVAC unit is running.
This data is mostly from Peak+ deployments in chiller yards of datacenters, which get significantly hotter than the surrounding areas due to many factors (hot air recirculation, generator exhaust, and sun exposure). So you will see that temperatures here are regularly above the historical ambient temperatures you would see online.
All sites below are spraying to maximize energy savings; however, Peak+ is also able to calibrate how often we spray to use the minimum amount of water to achieve a target maximum condenser inlet temperature. In these cases, Peak+ is only spraying enough water to achieve the desired temperature set by the customer.
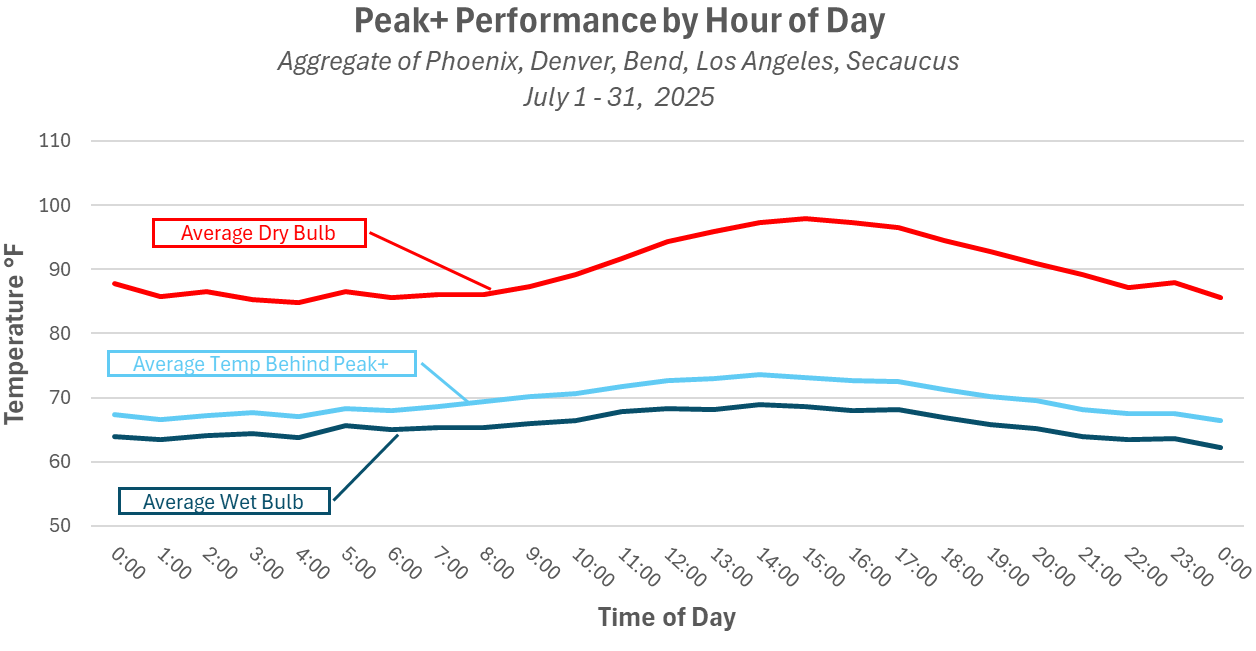
The below chart shows the relative temperatures by hour of day when Peak+ was in operation across all the sites included in this study. The x-axis is the time and the y-axis is the temperature. As you can see, the outdoor temperature rises over the course of the day Red, but with Peak+ installed your HVAC air inlet temperature Light Blue stays consistently low.
The following breaks out performance by location.
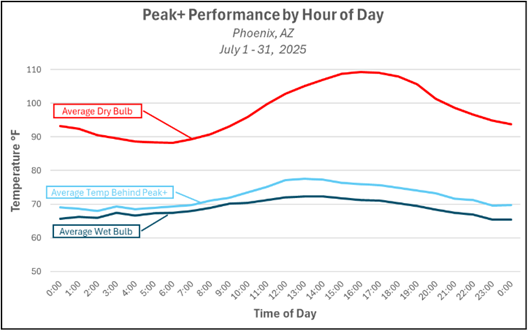
PHoenix, AZ
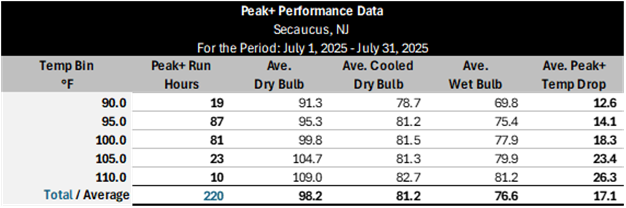
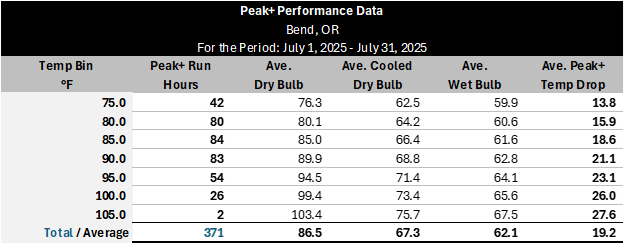
The table below shows summary temperature data by 5-degree temp. bins for July 2025 as well as average Dry Bulb & Wet bulb temps at those bins. The “Ave. Dry Bulb” is the ambient air temperature around the unit, and the “Ave. Cooled Dry Bulb” is the air temperature after being cooled by the Peak+ System (the temperature of the air entering the HVAC Coils). The “Ave. Peak+ Temp Drop” shows the cooling effect of Peak+.

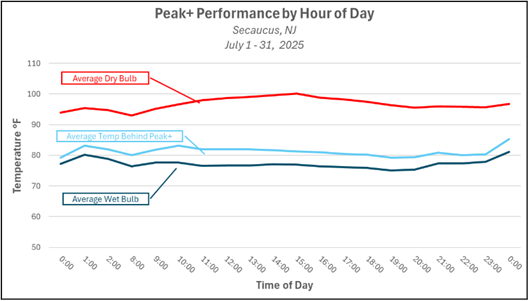
The below chart shows the relative temperatures by hour of day when Peak+ was in operation. The x-axis is the time and the y-axis is the temperature. As you can see, the outdoor temperature rises over the course of the day red, but with Peak+ installed your HVAC air inlet temperature light blue stays consistently low.
Denver, CO


Bend, OR

Los Angeles, Ca

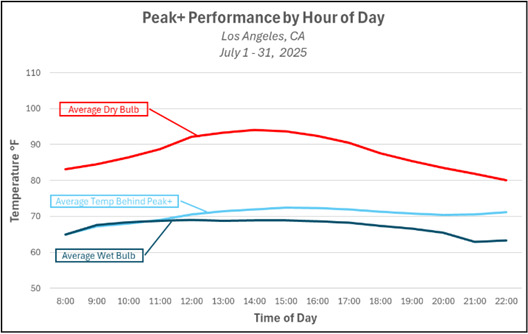
It should be noted that only the hours 8:00am – 10:00pm are included in the above chart. This is because there were no cooling hours (where Peak+ was in operation) at this site from 10pm to 8am over the course of July 2025.